
PLASTIMAGEN MÉXICO · ENERGY IN INJECTION MOULDING
Reduce energy costs in injection moulding.
Sustain the savings.
KERN IoP Energy monitors your injection-moulding machine and auxiliaries simultaneously. See where energy is used, identify savings opportunities and verify the impact of your decisions.
HARDWARE + DATA FOR YOUR CELL

ENERGY USE HAS A COST. SEE WHERE IT COMES FROM.
Plant decisions that influence your energy costs.
See where to act first.
Distinguish the energy used by the injection-moulding machine from that used by the dryer, temperature control unit and other auxiliaries. Focus on the equipment and operating periods that deserve attention.
Quantify the cost of idle time.
Identify your injection-moulding machine’s operating states and relate energy use to warm-up, production and idle periods. Quantify the energy used in each period and review the operating sequence.
Keep track of your improvements.
Compare energy use before and after an intervention, with production conditions documented. Track performance over time to spot deviations and act promptly.
KERN IoP ENERGY · OUR MEASUREMENT SYSTEM
One system to measure your machine and auxiliaries.
Bring electrical instrumentation, data acquisition and visualisation together in a configuration defined for your installation. Start with one cell and extend coverage as your needs develop.

Electrical instrumentation
Sensors and measurement for the selected single-phase or three-phase supply circuits.
Data acquisition and recording
Measurements from the instrumented circuits brought together for analysis.
Visualisation and historical data
Power, accumulated energy, machine operating states and historical records to understand consumption and compare periods, according to the configuration.

Useful data for production and engineering.
The SmartHUB is part of the system's data acquisition setup. The configuration is defined according to your electrical distribution, the currents to be measured and the equipment in your cell.
MEASURE EACH SUPPLY CIRCUIT. ANALYSE THE CELL.
The machine accounts for part of the energy use.
Simultaneous measurement reveals the contribution of each machine and auxiliary over the same operating periods.
Visualisation and analysis
Functional diagram. Equipment and measurement points are selected for each installation.
With production records integrated, you can calculate kWh/kg and kWh/part, and compare product runs under equivalent conditions.
KERN MONITOR · ENERGY AND MACHINE OPERATING STATES
Understand energy use in each operating state.
KERN IoP Energy can automatically detect operating states using the signals and rules configured for your injection-moulding machine. In KERN Monitor, relate these states to energy records to understand when and how energy is used.

Enlarge view ↗
Examples of configurable operating states
Production
Energy used during manufacturing periods.
Warm-up
Energy used during start-up and thermal preparation.
Idle
Consumption while the machine waits to resume production.
Switched off
Periods when the machine is off and the behaviour of the monitored auxiliaries.
Operating states are defined and validated for each installation. Plant personnel can add information about downtime causes.
Enlarge view ↗
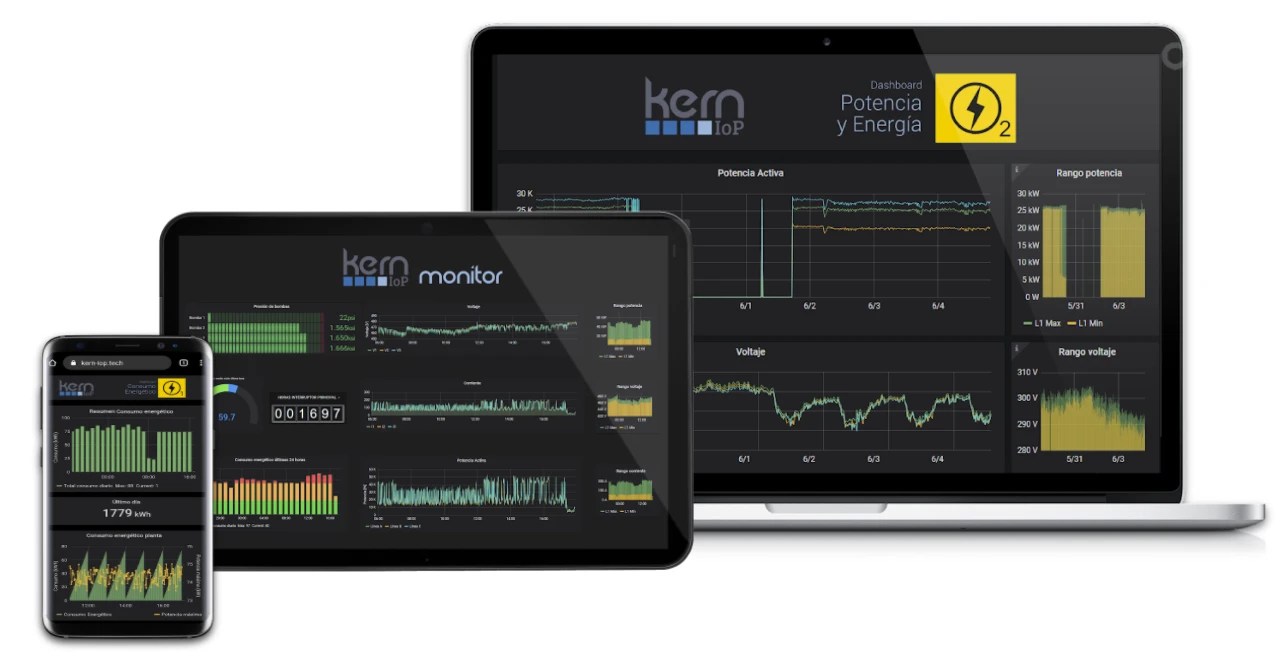
Review power curves and energy consumption over time.
KERN Monitor views let you explore electrical trends and energy consumption histories across different devices. Select the periods and variables you need to review with your plant team.
Energy use and cost
Review accumulated energy, cost calculated using the energy tariff, and specific energy consumption indicators when production data are integrated.
Energy use and activity
View energy records alongside machine operating states to investigate differences between periods and verify improvements.
SIMULATE THE FINANCIAL IMPACT
What would lower energy use mean for your costs?
Enter data for the cell or group of cells you want to assess. Explore an energy-reduction scenario and calculate its financial value.
Monthly value of reduced energy use
USD 1,680
Illustrative scenario with editable values. The percentage is a calculation assumption. Achievable savings depend on the baseline, the measures implemented and their validation. The calculation covers energy charges; demand charges and fixed charges are assessed separately. The annual projection assumes 12 equivalent months.
A CONFIGURATION WITH A CLEAR SCOPE
Start with one injection-moulding cell.
Define what you want to measure.
Tell us about the machine, its auxiliaries and the electrical information available.
Receive your proposed configuration.
We define measurement points, instrumentation, data acquisition and visualisation to prepare your quotation.
Measure and track performance.
Plan the installation with qualified personnel. Use the records to establish your baseline and verify improvements.
Questions to help you decide.
Can I start with a single machine?
Yes. The initial scope can cover the machine and priority auxiliaries, with the option to extend instrumentation later.
Will it work with my existing auxiliaries?
Measurement is configured around their single-phase or three-phase electrical supplies. We review voltages, currents, distribution and installation conditions to determine the appropriate configuration.
How is a cost reduction verified?
Measured kWh are compared before and after the changes using the same measurement scope, while accounting for product, production volume and operating conditions. The energy difference is valued using the applicable tariff.
How does the system identify operating states?
It uses the detection signals and rules configured for the machine. Operating states are validated during implementation; plant personnel can add downtime causes where further context is needed.
What information do I need to request a quote?
Your company name, country, number of cells and a description of the machine and its auxiliaries. Photographs of nameplates and electrical panels help refine the configuration during the technical review.
LET'S DISCUSS YOUR CELL · PLASTIMAGEN MÉXICO
Your next step: a configuration and a quote.
Tell us which equipment you want to monitor. Our team will review the application, define the scope of KERN IoP Energy and prepare your proposal.
- Machine and auxiliaries to be instrumented
- Number of cells and plant location
- Available electrical information
You can also email us at
info@pm-tec.co

